DrivAer65M on four A100 GPUs: an OpenFOAM benchmark alongside SPUMA
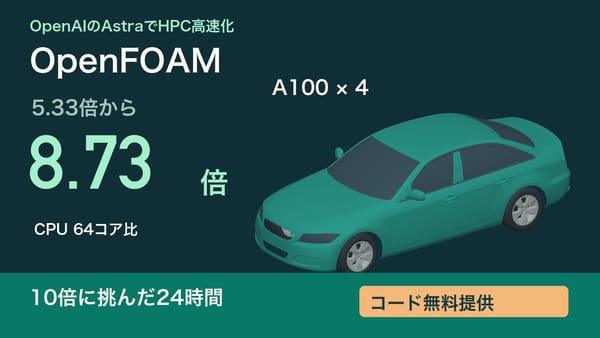
Four A100 PCIe 80 GB GPUs completed 480 SIMPLE iterations in 747.17 seconds. The same restart on 64 physical Xeon cores took 6,520.41 seconds. What does that 8.73× speedup tell us when a published four-A100 benchmark reports 172.41 seconds per 100 iterations?
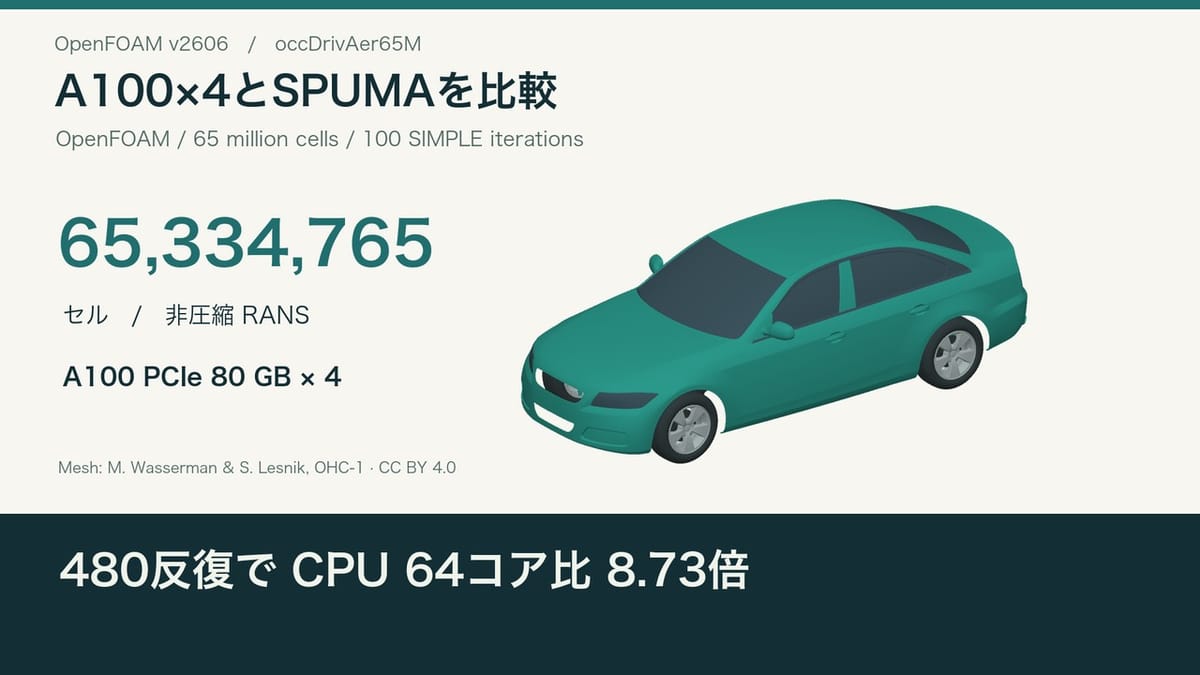
Four A100 PCIe 80 GB GPUs completed 480 SIMPLE iterations in 747.17 seconds. The same restart on 64 physical Xeon cores took 6,520.41 seconds. What does that 8.73× speedup tell us when a published four-A100 benchmark reports 172.41 seconds per 100 iterations?
Abstract. We benchmark a double-precision OpenFOAM v2606 implementation on the 65,334,765-cell occDrivAer mesh. We report end-to-end time, a 100-iteration interval, and fixed-iteration differences in the flow field. The comparison with SPUMA provides an external reference for throughput. Its linear solvers and stopping criteria differ from ours.
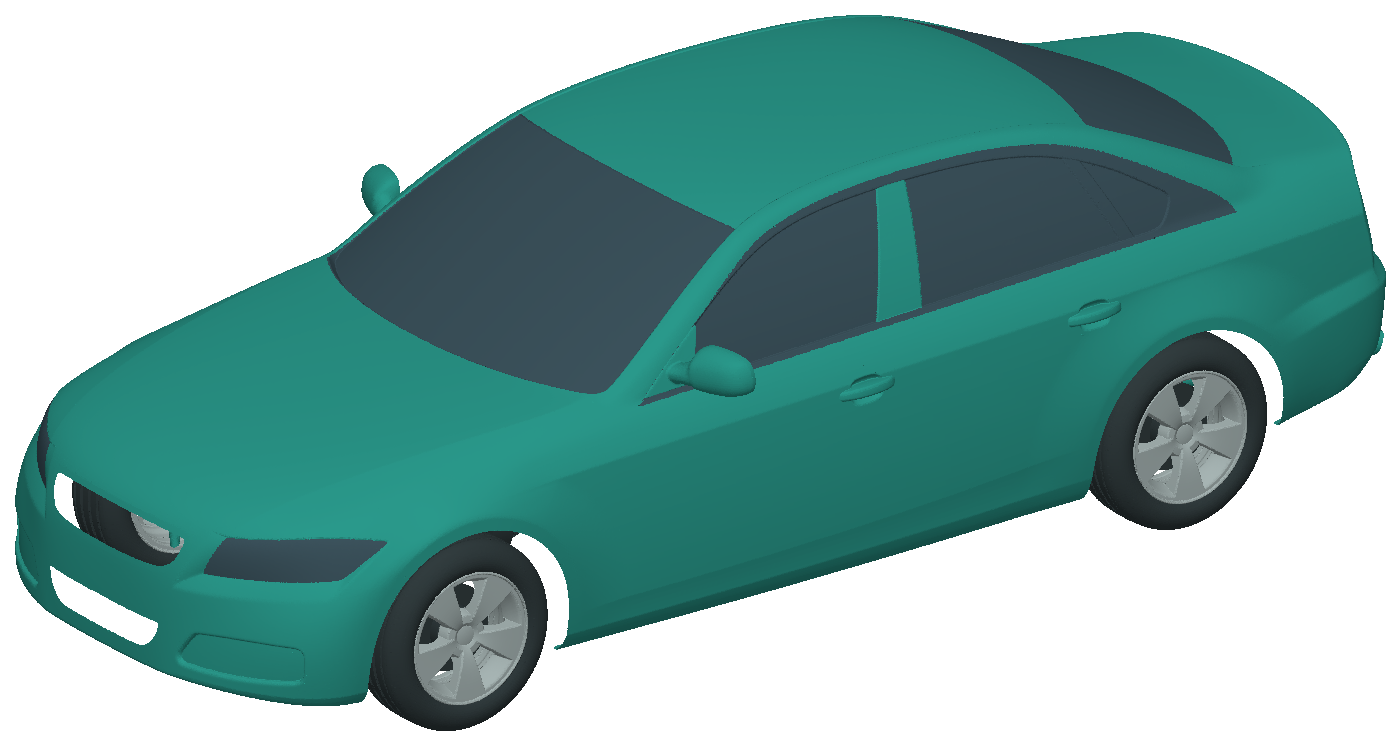
A reproducible unit of work
An outer SIMPLE iteration assembles and solves the momentum, pressure and turbulence equations. We used steady incompressible RANS with the k–ω SST model, double-precision fields and 32-bit indices. Both runs started from the same globally matched step-400 flow field. The CPU ran 64 MPI ranks on two Xeon Gold 6430 processors. The four GPUs ran one rank each, with Hilbert ordering within subdomains.
We fixed the inner work at 15 iterations for each velocity component, 12 GAMG cycles for pressure with 35 coarsest-grid PCG iterations, and 8 iterations for each turbulence variable. We timed from MPI launch to process exit, including initialization and writes at steps 480, 600, 720 and 840. The CPU reference was measured once. The selected GPU configuration was run twice independently, regenerating the wall-distance field each time.
End-to-end time on our hardware
| Configuration | 480 iterations (s) | Samples |
|---|---|---|
| Xeon Gold 6430 ×2 · 64 cores | 6,520.41 | 1 |
| A100 ×4 · earlier configuration | 775.70 mean | 2 |
| A100 ×4 · selected configuration | 747.17 mean | 747.68/746.66 s |
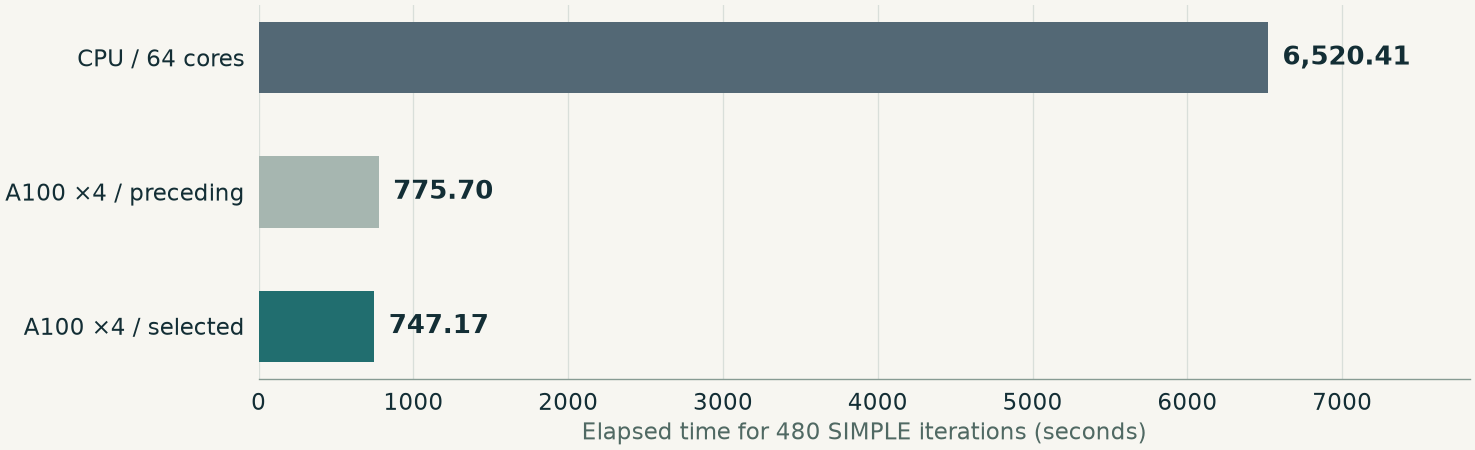
The selected configuration reduced elapsed time by 28.53 seconds (3.68%) relative to our preceding four-GPU configuration. Startup to the beginning of the first iteration fell from 51.40 to 36.41 seconds, and the first iteration from 25.00 to 17.27 seconds. The median ordinary iteration was 1.410 versus 1.401 seconds (mean of the two run medians, excluding steps 401–402 and output steps).
We moved wall-distance propagation and extraction to the GPU, parallelized near-wall geometry work on the CPU, and used stable GPU sorting for mesh and coarse-grid addressing. Relative neighbour indices fit into 16 bits for many entries, reducing memory traffic while preserving double-precision arithmetic. In four samples of two fine-grid kernels, Nsight Compute measured roughly 69–75% of sustained peak DRAM throughput. Profiling runs were excluded from timing.
The selected build also omits intermediate residual-norm reductions that do not govern stopping in these fixed-iteration pressure cycles. It retains final residual evaluation and singularity checks. In the tensor face-flux evaluation, it reuses the owner-cell tensor for adjacent faces after checking the floating-point operation order. The saved fields and emitted residual histories below test this combination.
Placing the result beside SPUMA
Bnà and colleagues measured elapsed time from the end of outer iteration 10 to the end of iteration 110 on the Leonardo supercomputer. The published GAMG results below all use the same approximately 65.3-million-cell mesh. Table 13.
| Solver and system | GPUs | 100 iterations (s) |
|---|---|---|
| SPUMA · Leonardo A100 | 2 | 302.80 |
| SPUMA · Leonardo A100 | 4 | 172.41 |
| SPUMA · Leonardo A100 | 8 | 116.56 |
| This work · PCIe A100 | 4 | 143.29 |
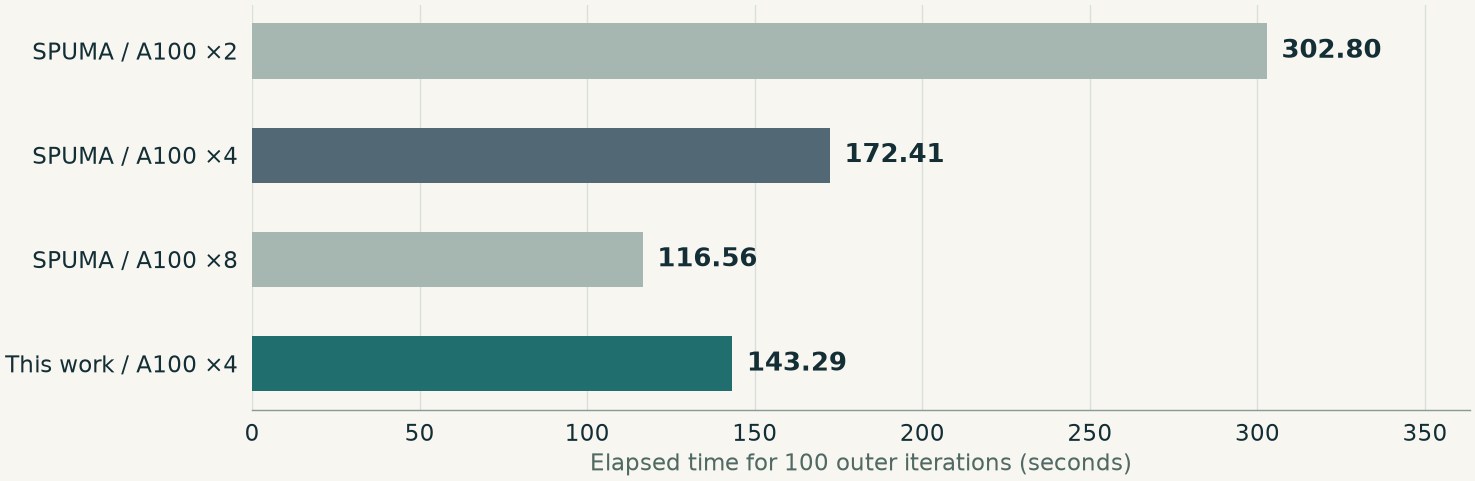
For the local entry, we restarted the simulation from its time-zero field and measured the same step-10 to step-110 boundary. We regenerated the four decomposed initial fields against the final mesh addressing and verified all 65,334,765 initial velocity vectors against the global field. The separate 480-iteration restart runs averaged 143.93 seconds from the end of step 410 to the end of step 510, including one field write.
The local interval took 16.9% less elapsed time than the four-GPU entry, equivalent to 1.20 times its outer-iteration throughput. The SPUMA runs used Leonardo’s 64 GB A100s and an OpenFOAM-v2412-based code. They used GAMG with Richardson smoothing for pressure and PBiCG with aDILU for velocity and turbulence, with relative tolerance 0.1. Our fixed inner iterations change the amount of work per outer iteration. Hardware, decomposition, initialization and output policies also affect elapsed time. This ratio compares the reported workloads and cannot isolate implementation speed or time to a solution of equal accuracy. Appendix A.
Numerical checks and limits
Across all 480 steps, force coefficients, the six equations’ initial and final residuals and iteration counts, and local, global and cumulative continuity errors agree with the preceding GPU run at the precision recorded. All 24 archived files for U, p, k, ω, nut and φ at step 840 were byte-identical across four subdomains. Against the 64-core CPU at the same step, unweighted cellwise relative L2 differences were 19.35% for velocity and 16.98% for pressure. These differences were evaluated after mapping every cell back to the original global index; relative L2 is ‖GPU−CPU‖₂/‖CPU‖₂.
Cell volume also changes how to interpret the spatial differences. With each squared error weighted by cell volume, the velocity and pressure differences become 0.35% and 6.84%, respectively. Both calculations cover the same cells.
The selected GPU log also records lower-bound corrections to ω in 480 steps and to k in 324 steps over the 480-iteration interval. These are counts of logged corrections, not counts of affected cells. They provide another reason to retain the distinction between throughput and solution quality.
The timing result establishes throughput for 480 iterations; it does not establish a converged drag or lift coefficient. Our planned HGX B300 experiment will repeat the four-way decomposition on four B300s before moving to eight GPUs, using the same checkpoint, inner iteration settings and output schedule.
Simulation data and code
Bnà et al., Computer Physics Communications 321 (2026), 110009 · arXiv:2512.22215 · CINECA / SPUMA · OpenFOAM HPC Technical Committee: occDrivAerStaticMesh · OHC-1 mesh files · CC BY 4.0 · Earlier A100 benchmark (Japanese).
Download per-iteration results and solver settings · Machine-readable measurements · Video explanation (Japanese) · English subtitles · 日本語字幕